
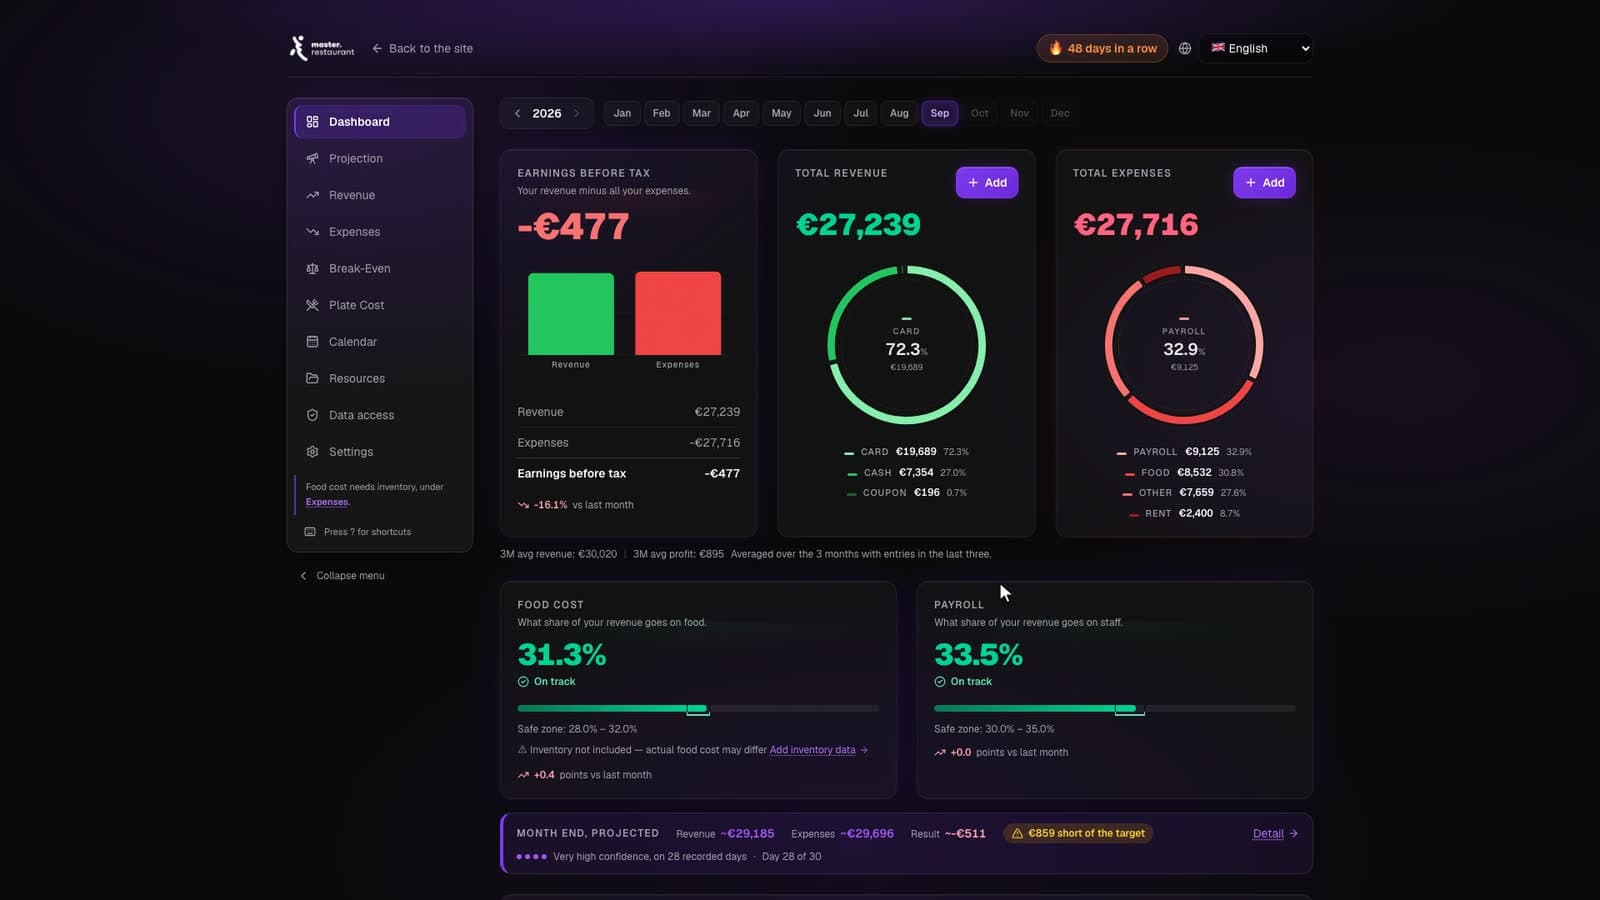
This is what your restaurant's dashboard looks like.
Not a screenshot and not a feature list — the screen you get on day one, with one month already in it. Read it the way you would read your own: what went wrong, what went right, and what it cost.
Example restaurant — Pizzeria Roma, June 2026
Pizzeria Roma is an invented restaurant — not a customer, not a case study and not a result anyone achieved. Every figure below is a worked example, and the arithmetic holds: the lines add up to the totals, and the totals add up to the profit. Nothing here can be edited or saved, and the same month is served fresh on every visit.
No signup
Ready in 30 minutes
Pizzeria Roma
Read-onlyRevenue and expenses
| Category | Amount |
|---|---|
| Revenue | €33,000 |
| Expenses | €31,820 |
| Earnings before tax | €1,180 |
Earnings before tax
Your revenue minus all your expenses.
€1,180
- Revenue
- €33,000
- Expenses
- -€31,820
- Earnings before tax
- €1,180
+11.1%vs last month
Total revenue
€33,000
| Category | Amount | Share |
|---|---|---|
| Card | €20,328 | 61.6% |
| Cash | €9,240 | 28.0% |
| Other | €3,432 | 10.4% |
| Total | €33,000 | 100.0% |
- Card€20,32861.6%
- Cash€9,24028.0%
- Other€3,43210.4%
Total expenses
€31,820
| Category | Amount | Share |
|---|---|---|
| Food | €12,672 | 39.8% |
| Payroll | €11,451 | 36.0% |
| Rent | €4,400 | 13.8% |
| Other | €3,297 | 10.4% |
| Total | €31,820 | 100.0% |
- Food€12,67239.8%
- Payroll€11,45136.0%
- Rent€4,40013.8%
- Other€3,29710.4%
Food cost
What share of your revenue goes on food.
38.4%
Above the safe zone — act
| Metric | Value |
|---|---|
| Food cost | 38.4% |
| Safe zone | 28.0% – 32.0% |
Safe zone: 28.0% – 32.0%
€2,112 more food than this month's revenue can carry.
+3.1points vs last month
Payroll
What share of your revenue goes on staff.
34.7%
On track
| Metric | Value |
|---|---|
| Payroll | 34.7% |
| Safe zone | 30.0% – 35.0% |
Safe zone: 30.0% – 35.0%
Back inside the band after 38.9% in May.
-4.2points vs last month
Revenue against break-even
Clear of break-even by €1,180
| Metric | Value |
|---|---|
| Revenue this month | €33,000 |
| Revenue needed to break-even | €31,820 |
| Left over | €1,180 |
- Revenue this month
- €33,000
- Paid for the month
- €31,820
- Left over
- €1,180
The first €31,820 of revenue only paid for the month. €1,180 is what was left — an average trading day here takes €1,100, so one quiet week would have wiped it out.
Prefer to watch? The whole dashboard in 14 minutes.
The same dashboard as above, screen by screen: why each function exists, what it tells you and how to use it.
Now put your own month in it.
Three days, your real numbers, no card. If your food cost is where Pizzeria Roma's is, you will see it on the first screen — while there is still something you can do about it.
Create your account
Name, email and password. No card, no payment.
Enter your month
One month of revenue and costs — the same lines you see for Pizzeria Roma.
Read the result
Food cost, payroll and break-even against the safe zones, just like in this example.
Ready in 30 minutes
Instant access
Pizzeria Roma does not exist. Its revenue, its expenses and every percentage on this page are a worked example, written to show how the dashboard reads one month — not research, not a benchmark, and not any customer's results. The figures are consistent on purpose, so you can check them: the expense lines total €31,820, the revenue lines total €33,000, and the difference is the €1,180 the month made. The one real figure here is ours: €4,000 saved in the first year we ran our own restaurant on these numbers.